On Wednesday, I brought out my QFO LE and set up at my local coffeeshop, DTUT, on the Upper East Side. This mix was recorded live from 8 - 10 pm while drinking some whiskey.
I played mostly funk and soul. I had a lot of fun with it.
P.S. I think this is the first mix of mine that’s floating around the interwebs. It’s a shame cause this one’s pretty sloppy. Some techincal reasons for that, but really – I’m out of practice.
Naturally, I talked about Stan. The point I wanted to get across was that statsitical modeling should be treated as a discipline. On the stan-users list and what I know to be common practice, I see people embedding statistical models within scripts. This makes it hard to collaborate and the software world has figured this out with tools like git.
We collaborate all the time. For the statistical models built for the Machine Madness Kaggle competition, we built models, checked them in, discussed them. If Rob Trangucci wasn’t around, we woudln’t have competed this year.
The Conference
Jared Lander, Jessica Lin, and the two crews from Lander Analytics and Work-Bench did a great job of organizing the conference. Each speaker was given 20 minutes to talk; no questions. It ran pretty smoothly and I picked up a lot of information about R’s development.
For me, highlights included:
JJ’s talk on RStudio’s new features and bookdown.org
Alp’s talk on ADVI
Andrew’s talk on social penumbras
Drew’s talk on social aspects of data science
Vivian’s talk about evoking emotions through data
Bas’s talk on program analysis
Josh’s talk on building packages for use at New York Times
A recurring theme this year was testing, which is a big step in the right direction.
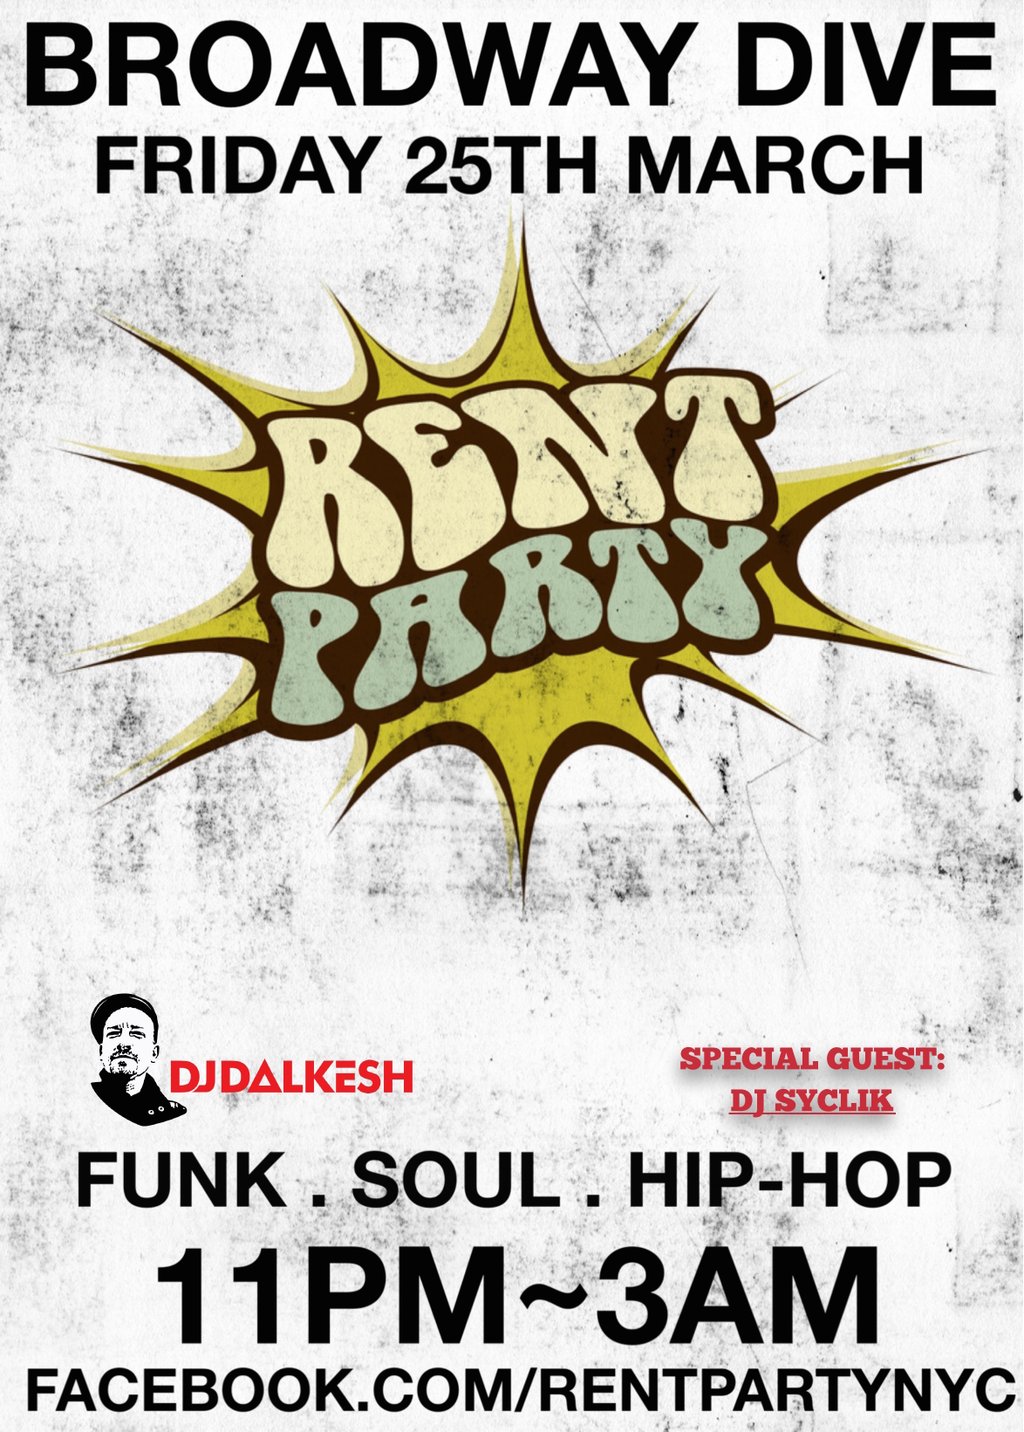
It’s been a while since I’ve had a gig. Been a little preoccupied with Stan, moving, a renovation, and a whole slew of other things. DJ Dalkesh asked me to do a guest spot at his monthly Rent Party at Broadway Dive on the Upper West Side.
Funk, soul, and hip hop all night. (good thing too… I don’t have the chops any more to do anything else.) Come through. It’ll be fun.
I found Plotly’s capability to be a bit lacking, so I spend another couple hours updating the map. Since creating the original data set, more alums have chimed in, so they’ve been included.
I have a new version written in Leaflet for R. This package is just as easy to use as Plotly, but with more options.
Peter Lee (2013) pointed me to CartoDB and I got my first proptype working there in 5 minutes, but it didn’t have enough control. It looks like the underlying Leaflet package drives CartoDB.
Nu Delts
Ideally, there would be a slider for years. For now, each year is in its own group.
Recently, there’s been an email thread with Nu Delta alumni going back to 1956 checking in from different geographic locations.
I took an hour, grabbed the data, and put people on a map. (It took me longer to enter the data and figure out how to embed the image than the actual work.)
Nu Delts
Sorry the map is a little clunky. This my first time using Plotly.
Edit: Looks like there are some bugs in Plotly showing the text. It works with Firefox. I’ll look into a different plotting package when I have some time.